u’: Rates with Large-Sample Correction
Like the p’ chart, the u’ chart is a u-Chart with the limits adjusted for large sample sizes.
The u’ chart to the left shows the monthly rate of NHS emergency patients seen within 4 hours of attendance.
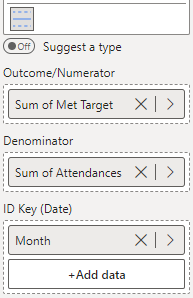
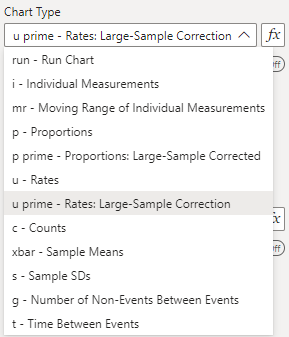
To construct this chart, you provide the numerator variable (number of attendances within target) in the ‘Outcome/Numerator’ field, the denominator variable (total number of attendances) in the ‘Denominator’ field, and the date variable (Month) in the ‘ID Key’ field (depicted below). Then, select the ‘u prime’ option from the ‘Data Settings’ dropdown.