PR: Funnel Plots for Proportions
The PR funnel chart is used for monitoring proportional outcomes across multiple sites
The PR funnel chart to the left shows the proportion of patients who reported that they were “satisfied” with their experience across 10 hospitals.
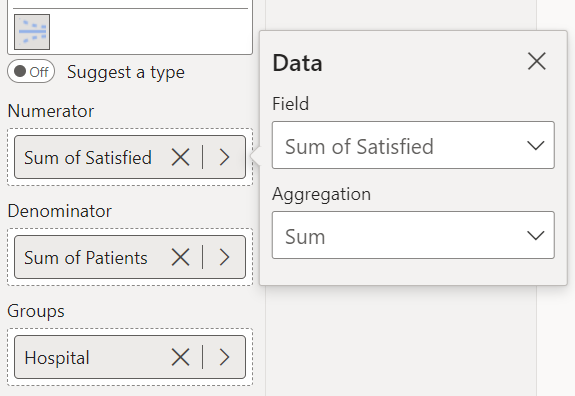
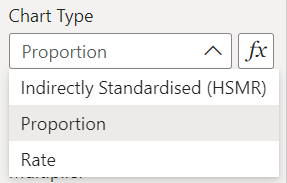
To construct this chart, you provide the numerator variable (number of observed events) in the ‘Numerator’ field, the denominator variable (number of opportunities for events to occur) in the ‘Denominator’ field, and the grouping variable (Hospital) in the ‘Groups’ field (depicted below). Then, select the ‘Proportion’ option from the ‘Data Settings’ dropdown.

