SR: Funnel Plots for Indirectly-Standardised Ratios (HSMR)
The SR funnel chart is primarily used for data where the numerator is the observed count of an outcome, and the denominator is the predicted or expected count of an outcome. This implies that the target value is 1 - we want our observations to be the same as our expectations.
The SR funnel chart to the left shows the observed total patient days compared to the expected total patient days across several hospitals
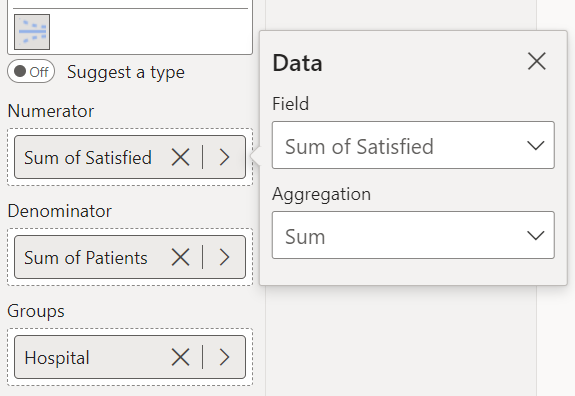
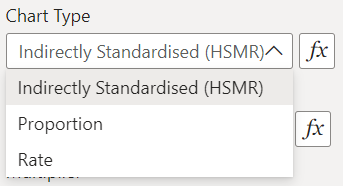
To construct this chart, you provide the numerator variable (observed outcome) in the ‘Numerator’ field, the denominator variable (expected outcome) in the ‘Denominator’ field, and the grouping variable (Hospital) in the ‘Groups’ field (depicted below). Then, select the ‘Indirectly Standardised’ option from the ‘Data Settings’ dropdown.

