c: Counts
The c chart is used for monitoring the count of events that happen over time.
The c chart to the left shows the monthly recordings of the number of events across an 18-month period.
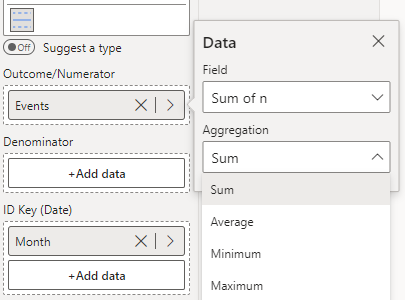
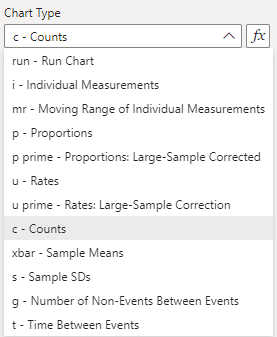
To construct this chart, you provide the outcome variable of interest (number of events) in the ‘Outcome/Numerator’ field, and the date variable (Month) in the ‘ID Key’ field (depicted below). Then, select the ‘c’ option from the ‘Data Settings’ dropdown.