mr: Moving Range of Individual Measurements
Moving Range (MR) charts plot the size of the difference between successive observations. These are used for monitoring the amount of timepoint-to-timepoint variability and are often interpreted in combination with an i-Chart.
The width of these limits is determined by the magnitude of difference between each successive observation.
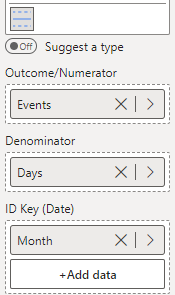
The chart to the left is utilising a feature of the custom visual - when both a numerator and denominator is supplied to the run, i, or MR charts, the ratio of the two will be used as the outcome.
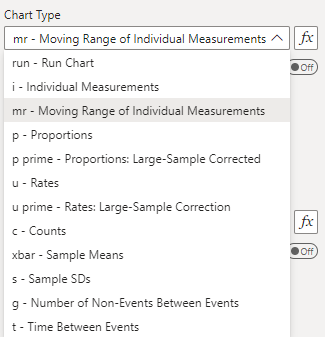
To construct this chart, you provide the numerator of interest in the ‘Outcome/Numerator’ field, the denominator of interest in the ‘Denominator’ field, and the date variable (Month) in the ‘ID Key’ field (depicted below). Then, select the ‘mr’ option from the ‘Data Settings’ dropdown.