p’: Proportions with Large-Sample Correction (also known as p-prime)
The p’ chart (pronounced “p-prime”) is used for monitoring proportion data with very large sample sizes or denominators. The p’ chart applies an adjustment called “Laney’s correction” to widen the control limits. This is needed as the width of control limits for a regular p-chart is determined by the size of the denominator. For samples with very large denominators, this can result in limits so narrow that all points are outliers.
The p’ chart to the left shows the monthly proportions of NHS emergency patients seen within 4 hours of attendance
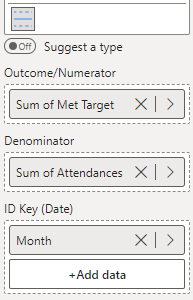
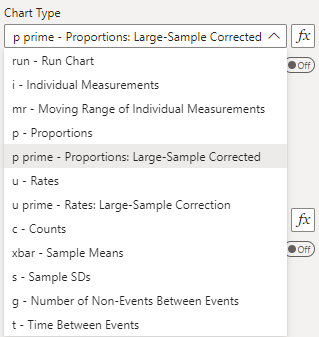
To construct this chart, you provide the numerator variable (number of attendances within target) in the ‘Outcome/Numerator’ field, the denominator variable (total number of attendances) in the ‘Denominator’ field, and the date variable (Month) in the ‘ID Key’ field (depicted below). Then, select the ‘p prime’ option from the ‘Data Settings’ dropdown.