p: Proportions
Proportion (p) charts are used for monitoring (as the name implies) proportional data.
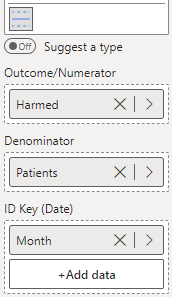
The p chart to the left shows the monthly proportion of patients that experienced a harmful event across an 18-month period
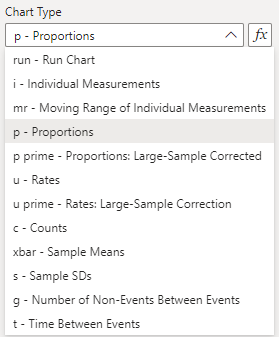
To construct this chart, you provide the numerator variable (number of events) in the ‘Outcome/Numerator’ field, the denominator variable (number of opportunities) in the ‘Denominator’ field, and the date variable (Month) in the ‘ID Key’ field (depicted below). Then, select the ‘p’ option from the ‘Data Settings’ dropdown.