t: Time Between Events
As an alternative to the g-Chart, we can instead monitor the amount of time between each event (rather than the number of non-events). This can be useful for data with no concept of a ‘non-event’ (i.e., there is nothing recorded until an actual event occurs).
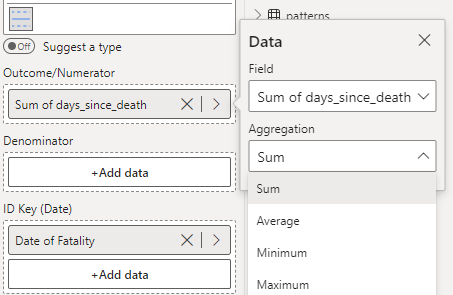
The t Chart to the left monitors the number of days between each recorded surgical fatality.
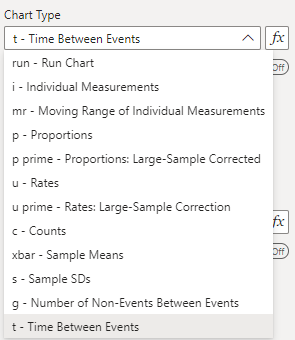
To construct this chart, you provide the outcome variable of interest (number of days) in the ‘Outcome/Numerator’ field, and the date variable (Month) in the ‘ID Key’ field (depicted below). Then, select the ‘t’ option from the ‘Data Settings’ dropdown.