u’: Rates with Large-Sample Correction
Like the p’ chart, the u’ chart is a u-Chart with the limits adjusted for large sample sizes.
The u’ chart below shows the monthly rate of NHS emergency patients seen within 4 hours of attendance.
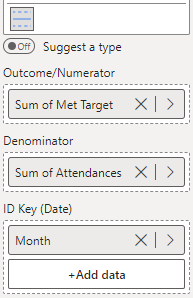
To construct this chart, you provide the numerator variable (number of attendances within target) in the ‘Outcome/Numerator’ field, the denominator variable (total number of attendances) in the ‘Denominator’ field, and the date variable (Month) in the ‘ID Key’ field (depicted below). Then, select u prime - Rates: Large-Sample Correction from the Chart Type drop-down in Data Settings.