u: Rates
Similar to a p chart, the u Chart is used for monitoring a rate of events over time. With these kinds of data, the numerator may exceed the denominator
The u chart to the left shows the rate of adverse events per patient day over an 18-month period.
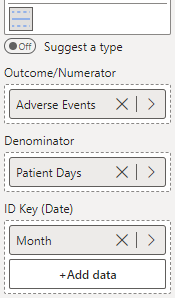
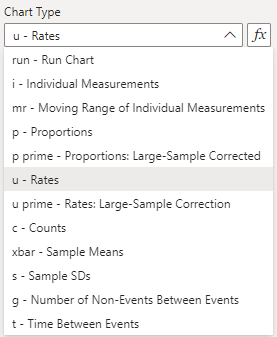
To construct this chart, you provide the numerator variable (number of events) in the ‘Outcome/Numerator’ field, the denominator variable (number of opportunities) in the ‘Denominator’ field, and the date variable (Month) in the ‘ID Key’ field (depicted below). Then, select the ‘p’ option from the ‘Data Settings’ dropdown.