Line Plot Aesthetics
With the line settings, users can modify the width, type and colour of the lines in the SPC chart. Each line has its own group of settings, listed below.
Additional Target Value
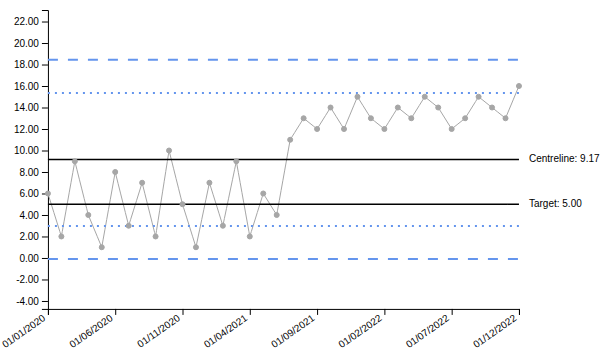
By default, the SPC chart depicts a statistical centerline as set by the chart type. This allows for a comparison of how the process may be changing over time, relative to historical results. However, there are applications where a target value may be appropriate to include as well. This can be set using Additional Target Value in the Alt. Target group, with Show Alt. Target Line turned on. The value is entered as a plotted value; turn on Apply Multiplier to Alt. Target to enter it as a raw proportion or rate instead.
The example below sets an additional target line at 5, and turns on Show Value on Plot for the target and alt. target lines to label them. The additional target line is black by default; its colour, width and type are set in the same group.
All Settings
Main
| Setting | Description | Default | Values |
|---|---|---|---|
| Show Main Line | Draws the line joining the points. | On | On or Off |
| Main Line Width | Line width, in pixels. | 1 | Number from 0 to 100 |
| Main Line Type | Dash pattern of the line. | Solid | • Solid (10 0)• Dashed ( 10 10)• Dotted ( 2 5) |
| Main Line Colour | Line colour. | #A6A6A6 |
Colour |
| Default Opacity | Line opacity while nothing is selected. | 1 | Number from 0 to 1 |
| Opacity if Any Selected | Line opacity while any point is selected. | 0.2 | Number from 0 to 1 |
| Connect Rebaselined Limits | Joins the line across a rebaseline; off leaves a gap. | Off | On or Off |
| Show Value on Plot | Writes the line’s value at its right-hand end. | Off | On or Off |
| Show Value at all Re-Baselines | Writes the value in every rebaseline period. | Off | On or Off |
| Show Value at Last N Re-Baselines | Writes the value in this many of the latest rebaseline periods. | 1 | Whole number, at least 1 |
| Position of Value on Line(s) | Where the value sits at the line’s end. Outside is below lower limits and above other lines; inside is the reverse. | Beside | • Outside (outside)• Inside ( inside)• Above ( above)• Below ( below)• Beside ( beside) |
| Value Vertical Padding | Vertical offset of the value from the line, in pixels. | 0 | Number |
| Value Horizontal Padding | Horizontal gap between the value and the line’s end, in pixels. | 10 | Number |
| Value Font | Font of the value. | 'Arial', sans-serif |
Font family |
| Value Font Size | Font size of the value, in pixels. | 10 | Number from 0 to 100 |
| Value Colour | Colour of the value. | #000000 |
Colour |
| Value Prefix | Text written before the value. | (blank) | Text |
Target
| Setting | Description | Default | Values |
|---|---|---|---|
| Show Target | Draws the centreline. | On | On or Off |
| Line Width | Line width, in pixels. | 1.5 | Number from 0 to 100 |
| Line Type | Dash pattern of the line. | Solid | • Solid (10 0)• Dashed ( 10 10)• Dotted ( 2 5) |
| Line Colour | Line colour. | #000000 |
Colour |
| Default Opacity | Line opacity while nothing is selected. | 1 | Number from 0 to 1 |
| Opacity if Any Selected | Line opacity while any point is selected. | 0.2 | Number from 0 to 1 |
| Connect Rebaselined Limits | Joins the line across a rebaseline; off leaves a gap. | Off | On or Off |
| Show value in tooltip | Shows this line’s value in the tooltip while the line is shown. | On | On or Off |
| Tooltip Label | Names this line in tooltips and any summary table. | Centerline |
Text |
| Show Value on Plot | Writes the line’s value at its right-hand end. | Off | On or Off |
| Show Value at all Re-Baselines | Writes the value in every rebaseline period. | Off | On or Off |
| Show Value at Last N Re-Baselines | Writes the value in this many of the latest rebaseline periods. | 1 | Whole number, at least 1 |
| Position of Value on Line(s) | Where the value sits at the line’s end. Outside is below lower limits and above other lines; inside is the reverse. | Beside | • Outside (outside)• Inside ( inside)• Above ( above)• Below ( below)• Beside ( beside) |
| Value Vertical Padding | Vertical offset of the value from the line, in pixels. | 0 | Number |
| Value Horizontal Padding | Horizontal gap between the value and the line’s end, in pixels. | 10 | Number |
| Value Font | Font of the value. | 'Arial', sans-serif |
Font family |
| Value Font Size | Font size of the value, in pixels. | 10 | Number from 0 to 100 |
| Value Colour | Colour of the value. | #000000 |
Colour |
| Value Prefix | Text written before the value. | (blank) | Text |
Alt. Target
| Setting | Description | Default | Values |
|---|---|---|---|
| Show Alt. Target Line | Draws a line at the Additional Target Value; the assurance icon needs it. | Off | On or Off |
| Additional Target Value: | Value of the target line, as a plotted value unless the multiplier is applied. | (blank) | Number |
| Apply Multiplier to Alt. Target | Multiplies the target by the Multiplier, for targets entered as raw proportions or rates. | Off | On or Off |
| Line Width | Line width, in pixels. | 1.5 | Number from 0 to 100 |
| Line Type | Dash pattern of the line. | Solid | • Solid (10 0)• Dashed ( 10 10)• Dotted ( 2 5) |
| Line Colour | Line colour. | #000000 |
Colour |
| Default Opacity | Line opacity while nothing is selected. | 1 | Number from 0 to 1 |
| Opacity if Any Selected | Line opacity while any point is selected. | 0.2 | Number from 0 to 1 |
| Connect Rebaselined Limits | Joins the line across a rebaseline; off leaves a gap. | Off | On or Off |
| Show value in tooltip | Shows this line’s value in the tooltip while the line is shown. | On | On or Off |
| Tooltip Label | Names this line in tooltips and any summary table. | Alt. Target |
Text |
| Show Value on Plot | Writes the line’s value at its right-hand end. | Off | On or Off |
| Show Value at all Re-Baselines | Writes the value in every rebaseline period. | Off | On or Off |
| Show Value at Last N Re-Baselines | Writes the value in this many of the latest rebaseline periods. | 1 | Whole number, at least 1 |
| Position of Value on Line(s) | Where the value sits at the line’s end. Outside is below lower limits and above other lines; inside is the reverse. | Beside | • Outside (outside)• Inside ( inside)• Above ( above)• Below ( below)• Beside ( beside) |
| Value Vertical Padding | Vertical offset of the value from the line, in pixels. | 0 | Number |
| Value Horizontal Padding | Horizontal gap between the value and the line’s end, in pixels. | 10 | Number |
| Value Font | Font of the value. | 'Arial', sans-serif |
Font family |
| Value Font Size | Font size of the value, in pixels. | 10 | Number from 0 to 100 |
| Value Colour | Colour of the value. | #000000 |
Colour |
| Value Prefix | Text written before the value. | (blank) | Text |
68% Limits
| Setting | Description | Default | Values |
|---|---|---|---|
| Show 68% Lines | Draws the one-sigma lines. | Off | On or Off |
| Line Width | Line width, in pixels. | 2 | Number from 0 to 100 |
| Line Type | Dash pattern of the line. | Dotted | • Solid (10 0)• Dashed ( 10 10)• Dotted ( 2 5) |
| Line Colour | Line colour. | #6495ED |
Colour |
| Default Opacity | Line opacity while nothing is selected. | 1 | Number from 0 to 1 |
| Opacity if Any Selected | Line opacity while any point is selected. | 0.2 | Number from 0 to 1 |
| Connect Rebaselined Limits | Joins the line across a rebaseline; off leaves a gap. | Off | On or Off |
| Show value in tooltip | Shows this line’s value in the tooltip while the line is shown. | On | On or Off |
| Tooltip Label | Names this line in tooltips and any summary table. | 68% Limit |
Text |
| Tooltip Label - Lower Prefix | Text before the tooltip label for the lower line. | Lower |
Text |
| Tooltip Label - Upper Prefix | Text before the tooltip label for the upper line. | Upper |
Text |
| Show Value on Plot | Writes the line’s value at its right-hand end. | Off | On or Off |
| Show Value at all Re-Baselines | Writes the value in every rebaseline period. | Off | On or Off |
| Show Value at Last N Re-Baselines | Writes the value in this many of the latest rebaseline periods. | 1 | Whole number, at least 1 |
| Position of Value on Line(s) | Where the value sits at the line’s end. Outside is below lower limits and above other lines; inside is the reverse. | Beside | • Outside (outside)• Inside ( inside)• Above ( above)• Below ( below)• Beside ( beside) |
| Value Vertical Padding | Vertical offset of the value from the line, in pixels. | 0 | Number |
| Value Horizontal Padding | Horizontal gap between the value and the line’s end, in pixels. | 10 | Number |
| Value Font | Font of the value. | 'Arial', sans-serif |
Font family |
| Value Font Size | Font size of the value, in pixels. | 10 | Number from 0 to 100 |
| Value Colour | Colour of the value. | #000000 |
Colour |
| Value Prefix | Text written before the value. | (blank) | Text |
95% Limits
| Setting | Description | Default | Values |
|---|---|---|---|
| Show 95% Lines | Draws the two-sigma lines. | On | On or Off |
| Line Width | Line width, in pixels. | 2 | Number from 0 to 100 |
| Line Type | Dash pattern of the line. | Dotted | • Solid (10 0)• Dashed ( 10 10)• Dotted ( 2 5) |
| Line Colour | Line colour. | #6495ED |
Colour |
| Default Opacity | Line opacity while nothing is selected. | 1 | Number from 0 to 1 |
| Opacity if Any Selected | Line opacity while any point is selected. | 0.2 | Number from 0 to 1 |
| Connect Rebaselined Limits | Joins the line across a rebaseline; off leaves a gap. | Off | On or Off |
| Show value in tooltip | Shows this line’s value in the tooltip while the line is shown. | On | On or Off |
| Tooltip Label | Names this line in tooltips and any summary table. | 95% Limit |
Text |
| Tooltip Label - Lower Prefix | Text before the tooltip label for the lower line. | Lower |
Text |
| Tooltip Label - Upper Prefix | Text before the tooltip label for the upper line. | Upper |
Text |
| Show Value on Plot | Writes the line’s value at its right-hand end. | Off | On or Off |
| Show Value at all Re-Baselines | Writes the value in every rebaseline period. | Off | On or Off |
| Show Value at Last N Re-Baselines | Writes the value in this many of the latest rebaseline periods. | 1 | Whole number, at least 1 |
| Position of Value on Line(s) | Where the value sits at the line’s end. Outside is below lower limits and above other lines; inside is the reverse. | Beside | • Outside (outside)• Inside ( inside)• Above ( above)• Below ( below)• Beside ( beside) |
| Value Vertical Padding | Vertical offset of the value from the line, in pixels. | 0 | Number |
| Value Horizontal Padding | Horizontal gap between the value and the line’s end, in pixels. | 10 | Number |
| Value Font | Font of the value. | 'Arial', sans-serif |
Font family |
| Value Font Size | Font size of the value, in pixels. | 10 | Number from 0 to 100 |
| Value Colour | Colour of the value. | #000000 |
Colour |
| Value Prefix | Text written before the value. | (blank) | Text |
99% Limits
| Setting | Description | Default | Values |
|---|---|---|---|
| Show 99% Lines | Draws the three-sigma control limits. | On | On or Off |
| Line Width | Line width, in pixels. | 2 | Number from 0 to 100 |
| Line Type | Dash pattern of the line. | Dashed | • Solid (10 0)• Dashed ( 10 10)• Dotted ( 2 5) |
| Line Colour | Line colour. | #6495ED |
Colour |
| Default Opacity | Line opacity while nothing is selected. | 1 | Number from 0 to 1 |
| Opacity if Any Selected | Line opacity while any point is selected. | 0.2 | Number from 0 to 1 |
| Connect Rebaselined Limits | Joins the line across a rebaseline; off leaves a gap. | Off | On or Off |
| Show value in tooltip | Shows this line’s value in the tooltip while the line is shown. | On | On or Off |
| Tooltip Label | Names this line in tooltips and any summary table. | 99% Limit |
Text |
| Tooltip Label - Lower Prefix | Text before the tooltip label for the lower line. | Lower |
Text |
| Tooltip Label - Upper Prefix | Text before the tooltip label for the upper line. | Upper |
Text |
| Show Value on Plot | Writes the line’s value at its right-hand end. | Off | On or Off |
| Show Value at all Re-Baselines | Writes the value in every rebaseline period. | Off | On or Off |
| Show Value at Last N Re-Baselines | Writes the value in this many of the latest rebaseline periods. | 1 | Whole number, at least 1 |
| Position of Value on Line(s) | Where the value sits at the line’s end. Outside is below lower limits and above other lines; inside is the reverse. | Beside | • Outside (outside)• Inside ( inside)• Above ( above)• Below ( below)• Beside ( beside) |
| Value Vertical Padding | Vertical offset of the value from the line, in pixels. | 0 | Number |
| Value Horizontal Padding | Horizontal gap between the value and the line’s end, in pixels. | 10 | Number |
| Value Font | Font of the value. | 'Arial', sans-serif |
Font family |
| Value Font Size | Font size of the value, in pixels. | 10 | Number from 0 to 100 |
| Value Colour | Colour of the value. | #000000 |
Colour |
| Value Prefix | Text written before the value. | (blank) | Text |
Specification Limits
| Setting | Description | Default | Values |
|---|---|---|---|
| Show Specification Lines | Draws the specification limits, which patterns using the Specification limit need. | Off | On or Off |
| Upper Specification Limit: | Upper specification limit, as a plotted value unless the multiplier is applied. | (blank) | Number |
| Lower Specification Limit: | Lower specification limit, as a plotted value unless the multiplier is applied. | (blank) | Number |
| Apply Multiplier to Specification Limits | Multiplies the limits by the Multiplier, for limits entered as raw proportions or rates. | Off | On or Off |
| Line Width | Line width, in pixels. | 2 | Number from 0 to 100 |
| Line Type | Dash pattern of the line. | Dashed | • Solid (10 0)• Dashed ( 10 10)• Dotted ( 2 5) |
| Line Colour | Line colour. | #6495ED |
Colour |
| Default Opacity | Line opacity while nothing is selected. | 1 | Number from 0 to 1 |
| Opacity if Any Selected | Line opacity while any point is selected. | 0.2 | Number from 0 to 1 |
| Connect Rebaselined Limits | Joins the line across a rebaseline; off leaves a gap. | Off | On or Off |
| Show value in tooltip | Shows this line’s value in the tooltip while the line is shown. | On | On or Off |
| Tooltip Label | Names this line in tooltips and any summary table. | Specification Limit |
Text |
| Tooltip Label - Lower Prefix | Text before the tooltip label for the lower line. | Lower |
Text |
| Tooltip Label - Upper Prefix | Text before the tooltip label for the upper line. | Upper |
Text |
| Show Value on Plot | Writes the line’s value at its right-hand end. | Off | On or Off |
| Show Value at all Re-Baselines | Writes the value in every rebaseline period. | Off | On or Off |
| Show Value at Last N Re-Baselines | Writes the value in this many of the latest rebaseline periods. | 1 | Whole number, at least 1 |
| Position of Value on Line(s) | Where the value sits at the line’s end. Outside is below lower limits and above other lines; inside is the reverse. | Beside | • Outside (outside)• Inside ( inside)• Above ( above)• Below ( below)• Beside ( beside) |
| Value Vertical Padding | Vertical offset of the value from the line, in pixels. | 0 | Number |
| Value Horizontal Padding | Horizontal gap between the value and the line’s end, in pixels. | 10 | Number |
| Value Font | Font of the value. | 'Arial', sans-serif |
Font family |
| Value Font Size | Font size of the value, in pixels. | 10 | Number from 0 to 100 |
| Value Colour | Colour of the value. | #000000 |
Colour |
| Value Prefix | Text written before the value. | (blank) | Text |
Trend
| Setting | Description | Default | Values |
|---|---|---|---|
| Show Trend | Draws a least-squares trend line through each rebaseline period. | Off | On or Off |
| Line Width | Line width, in pixels. | 1.5 | Number from 0 to 100 |
| Line Type | Dash pattern of the line. | Solid | • Solid (10 0)• Dashed ( 10 10)• Dotted ( 2 5) |
| Line Colour | Line colour. | #A6A6A6 |
Colour |
| Default Opacity | Line opacity while nothing is selected. | 1 | Number from 0 to 1 |
| Opacity if Any Selected | Line opacity while any point is selected. | 0.2 | Number from 0 to 1 |
| Connect Rebaselined Limits | Joins the line across a rebaseline; off leaves a gap. | Off | On or Off |
| Show value in tooltip | Shows this line’s value in the tooltip while the line is shown. | On | On or Off |
| Tooltip Label | Names this line in tooltips and any summary table. | Trend |
Text |
| Show Value on Plot | Writes the line’s value at its right-hand end. | Off | On or Off |
| Show Value at all Re-Baselines | Writes the value in every rebaseline period. | Off | On or Off |
| Show Value at Last N Re-Baselines | Writes the value in this many of the latest rebaseline periods. | 1 | Whole number, at least 1 |
| Position of Value on Line(s) | Where the value sits at the line’s end. Outside is below lower limits and above other lines; inside is the reverse. | Beside | • Outside (outside)• Inside ( inside)• Above ( above)• Below ( below)• Beside ( beside) |
| Value Vertical Padding | Vertical offset of the value from the line, in pixels. | 0 | Number |
| Value Horizontal Padding | Horizontal gap between the value and the line’s end, in pixels. | 10 | Number |
| Value Font | Font of the value. | 'Arial', sans-serif |
Font family |
| Value Font Size | Font size of the value, in pixels. | 10 | Number from 0 to 100 |
| Value Colour | Colour of the value. | #000000 |
Colour |
| Value Prefix | Text written before the value. | (blank) | Text |