i: Individual Measurements (also known as XmR)
Similar to a run chart, an i Chart is used for monitoring a single observation over time. The key difference is that there are now upper and lower control limits. The width of these limits is determined by the magnitude of difference between each successive observation.
The i chart to the left shows the monthly recordings of the number of events across an 18-month period.
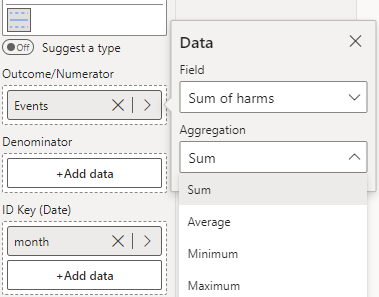
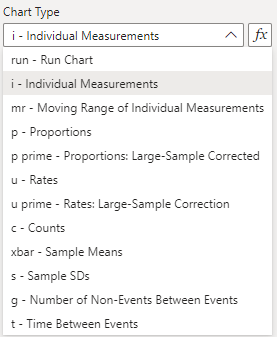
To construct this chart, you provide the outcome variable of interest (number of events) in the ‘Outcome/Numerator’ field, and the date variable (Month) in the ‘ID Key’ field (depicted below). Then, select the ‘i’ option from the ‘Data Settings’ dropdown.