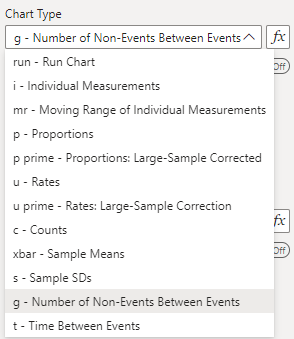
g: Number of Non-events Between Events
When monitoring a process that happens infrequently or rarely, a normal SPC chart may not be very useful - as most values would be zero. Instead of monitoring a monthly proportion/rate of events, we can instead monitor the number of times that an event did not occur (when it had the opportunity to) before an event is recorded.
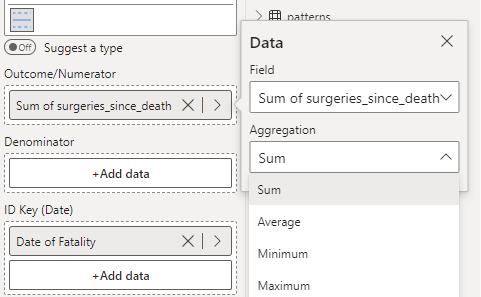
The g Chart to the left monitors the number of successful surgeries between each recorded fatality.
To construct this chart, you provide the outcome variable of interest (number of non-events) in the ‘Outcome/Numerator’ field, and the date variable (Month) in the ‘ID Key’ field (depicted below). Then, select the ‘g’ option from the ‘Data Settings’ dropdown.