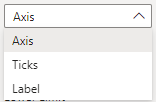
X-Axis Aesthetics
All settings related to formatting the x-axis are available in this section. These are grouped by the three categories, Axis, Ticks and Label.
Axis
The Axis settings adjust the colour of the x-axis and any truncation in the lower and upper dates.
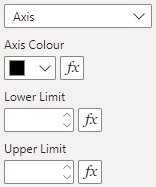
- Axis Colour - The colour of the horizontal line and ticks (default is black)
- Lower Limit - Set the lower limit of the x-axis using an integer. A positive integer will truncate the points displayed on the chart, a negative integer will create whitespace on the left of the SPC lines.
- Upper Limit - Set the upper limit of the x-axis using an integer. This sets the right hand side upper limit to be displayed on the chart
Please note that although the lower and upper limit truncate the SPC chart, the centerline and limits are not recalculated and will be based on all the data available.
Ticks
The Tick settings adjust the placement and formatting of the ticks, and the formatting of the tick text.
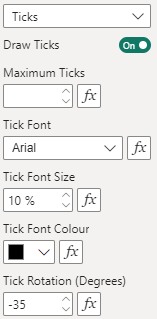
- Draw Ticks - A toggle for whether x-axis ticks and labels should be drawn (default is on)
- Maximum Ticks - A numeric value of the maximum number of ticks that should be displayed on the x-axis. The value input here does not necessarily correlate with the number of ticks displayed, as the visual attempts to evenly space the ticks.
- Tick Font - Font of the tick text (default is Arial)
- Tick Font Size - Size of the tick text (default is 10%)
- Tick Font Colour - Colour of the tick text (default is black)
- Tick Rotation (Degrees) - The degrees of rotation for the x-axis ticks labels (default is -35)
Label
The label settings create and format the x-axis label.
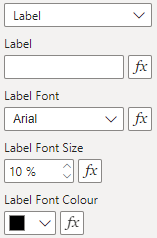
- Label - The text of the x-axis label.
- Label Font - Font of the label text (default is Arial)
- Label Font Size - Size of the label text (default is 10%)
- Label Font Colour - Colour of the label text (default is black)